Halpha in CVs
The Cluster
According to Harris we have the following information for NGC 6397:
- \(v_r\) Heliocentric radial velocity (km/s)
- \(\pm\) Observational (internal) uncertainty in radial velocity
- \(v_{LSR}\) Radial velocity relative to Solar neighborhood LSR
- \(\sigma_v\) Central velocity dispersion (km/s)
- \(\pm\) Observational (internal) uncertainty in velocity dispersion
| Cluster | \(v_r\) | \(\pm\) | \(v_{LSR}\) | \(\sigma_v\) | \(\pm\) |
|---|---|---|---|---|---|
| NGC 6397 | 18.0 | 0.1 | 20.3 | 4.5 | 0.2 |
With these velocities we have a shift of:
\[ \text{shift} (\unicode{x212B}) = \text{rest wavelenght} (\unicode{x212B}) \times \frac{\text{radial velocity}}{c} \]
For a velocity of 18 \(km/s\) and waveleght of 5875 (He I) we get a shift of \(0.3 \, \unicode{x212B}.\)
H\(\alpha\) lines in CVs in NGC 6397
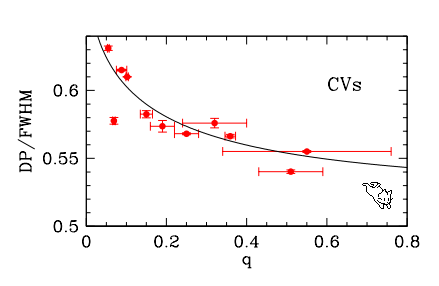
Casares16 finds a correlation between the mass ratio q and the ratio of double peak separation to the full-width-half maximum of the H\(\alpha\) emission. This is find for Black holes but his data also includes CVs.
Fig 2 in Casares16 shows the correlation for the sampled CVs.
The case for NGC 6397
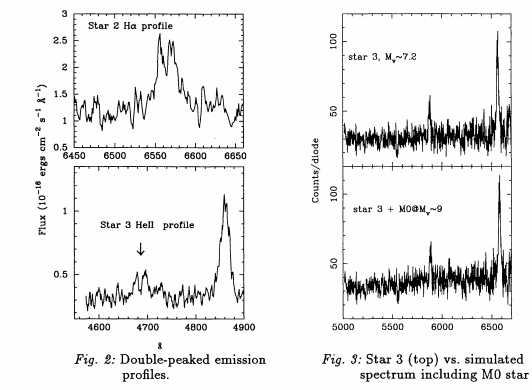
Some known spectra
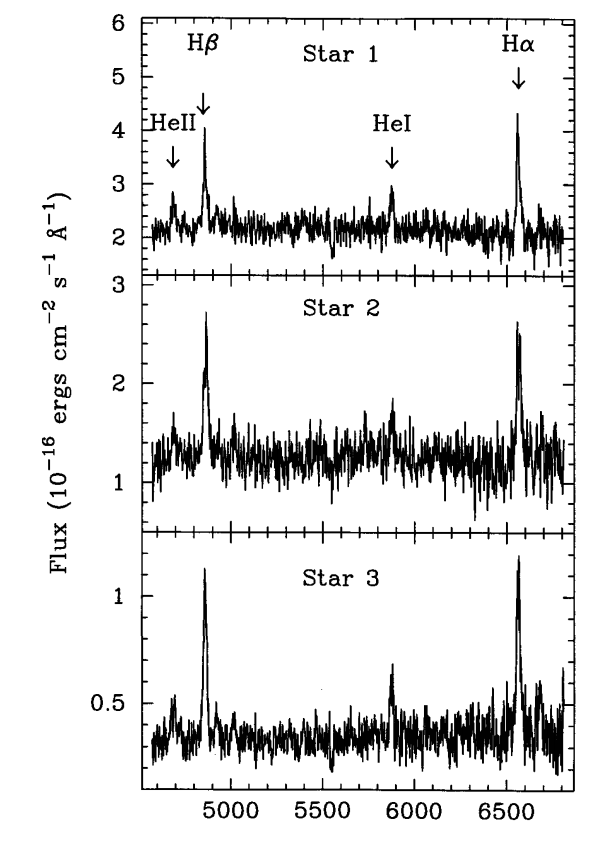
High resolution Spectra from Grindlay
The Method
Using Pyraf to analyze the spectra and QFitsView to extract the spectra from the processed MUSE data cube.
They can be extracted from the datacube with QFitsView typing in the DPUSER console:
DPUSER> 3dspec(<Cube buffer>,<pixel x>, <pixel y>, <dimension of cross selector>, <operator>)For example:
DPUSER> 3dspec(buffer2,229, 258,1, /sum)The location of the CVs are the following:
ID RA (J2000) DEC (J2000) Xpixel Ypixel Mag in R
U21 17:40:42.006 -53:40:22.07 219 247 19.82
U23 17:40:41.781 -53:40:19.87 229 258 17.88
U17 17:40:42.839 -53:40:20.27 182 256 18.52
U19 17:40:42.456 -53:40:29.87 196 211 18.87
U22 17:40:41.871 -53:40:29.67 225 209 20.15
U25 17:40:41.398 -53:40:26.67 246 224 23.48
U13 17:40:44.235 -53:40:40.07 120 157 24.0
U61 17:40:45.360 -53:40:29.07 70 212 22.08
U10 17:40:49.171 -53:39:49.43 134 247 19.14
The IDs and magnitudes are from Cohn10
To extrac the spectra was using the deblending as explain here
The CVs
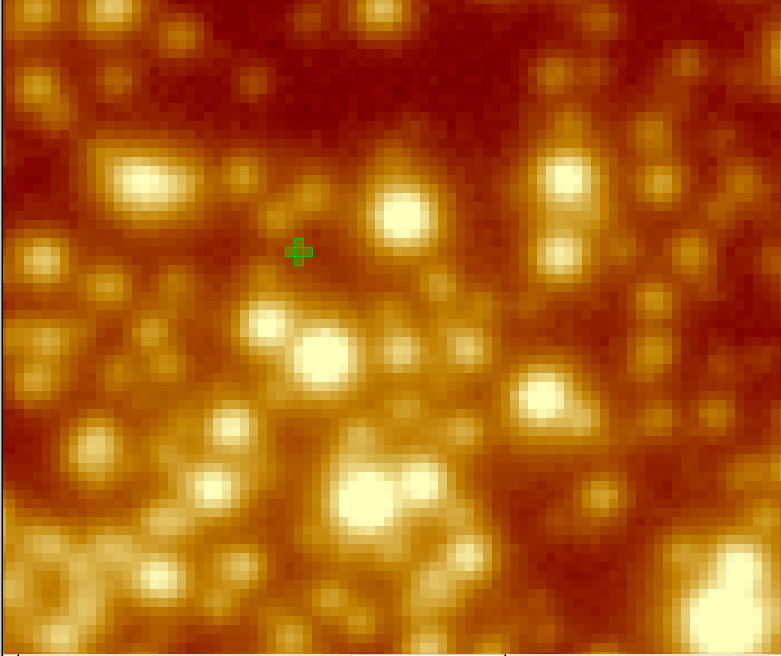
Below I present the spectra extracted for the source and an screen shot of the region as seen by MUSE. The screenshot is taken of the average of all wavelenght.
U21 (CV4)
MUSE white image
The Spectra and H\(\alpha\) line
The Spectra
splot spectra/U21_nozap.fits xmin=6400 xmax=6660
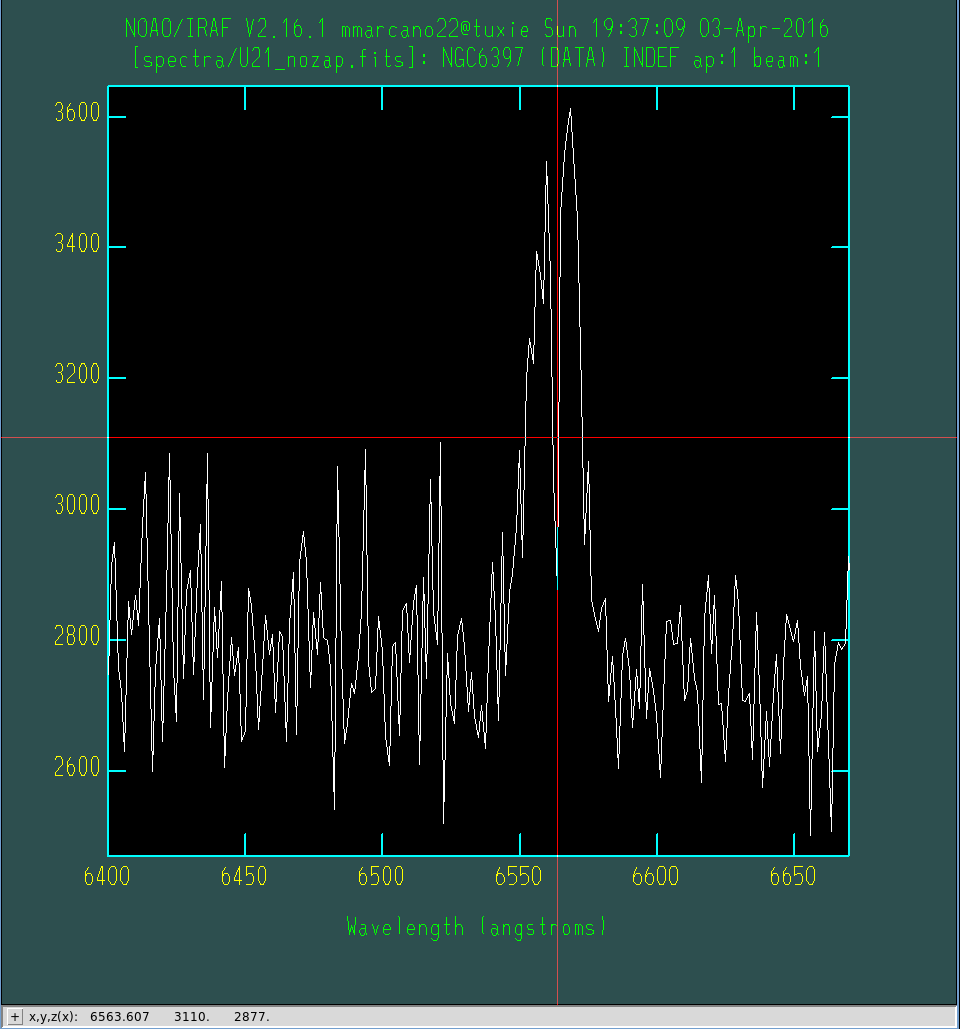
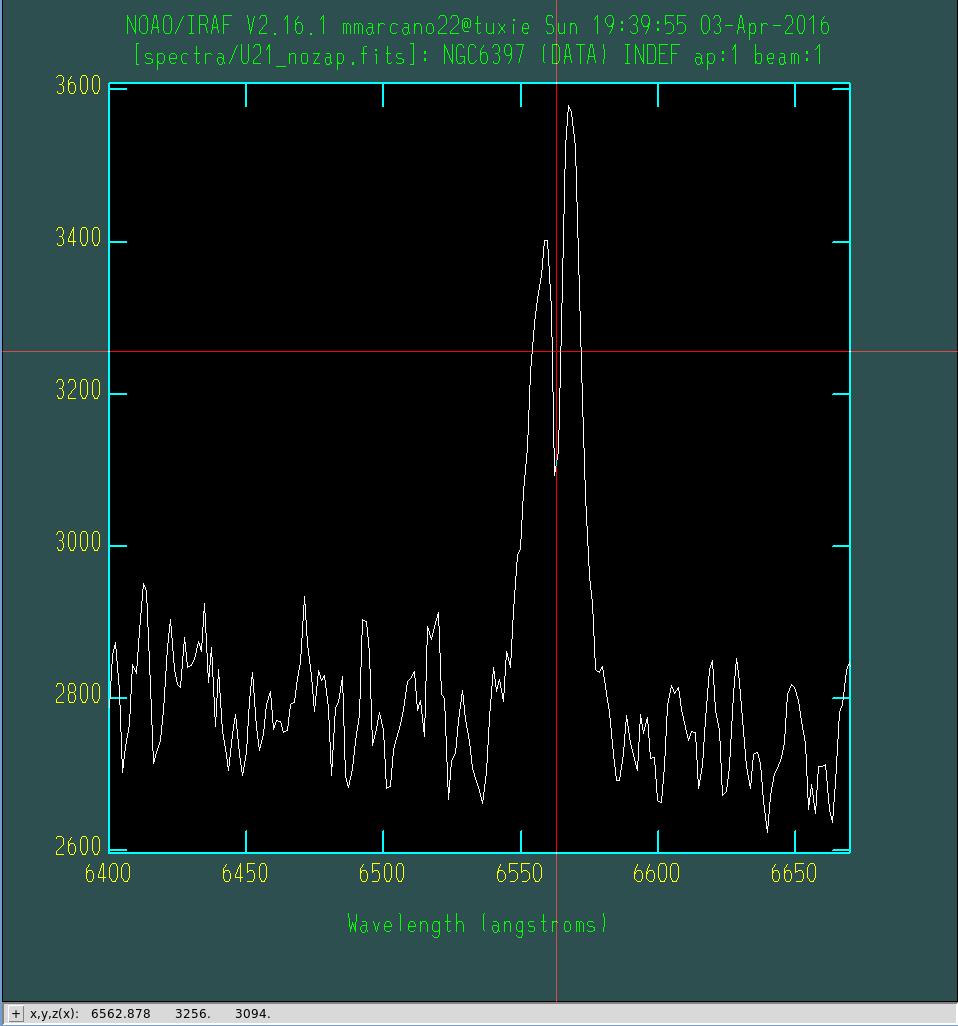
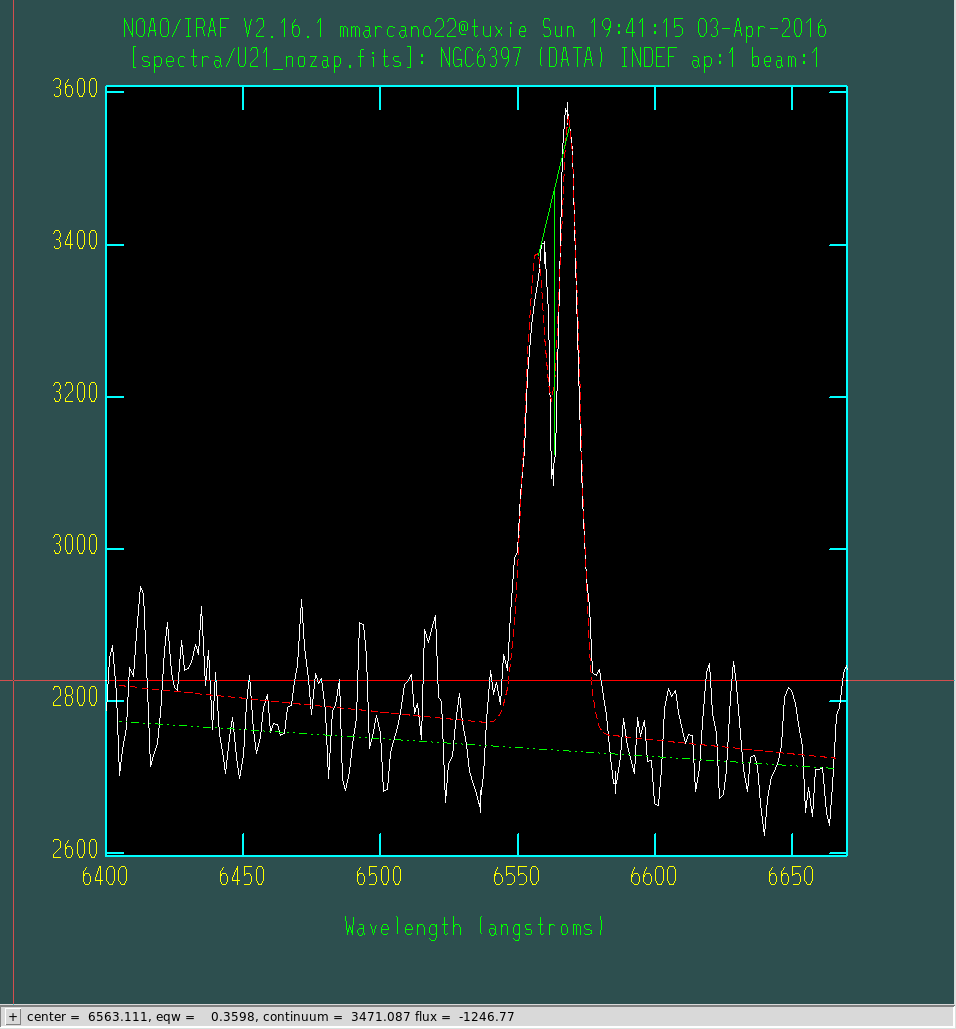
We get:
- For the Double Peak: Center at 6563.111 and eqw of 0.3598 Ångström.
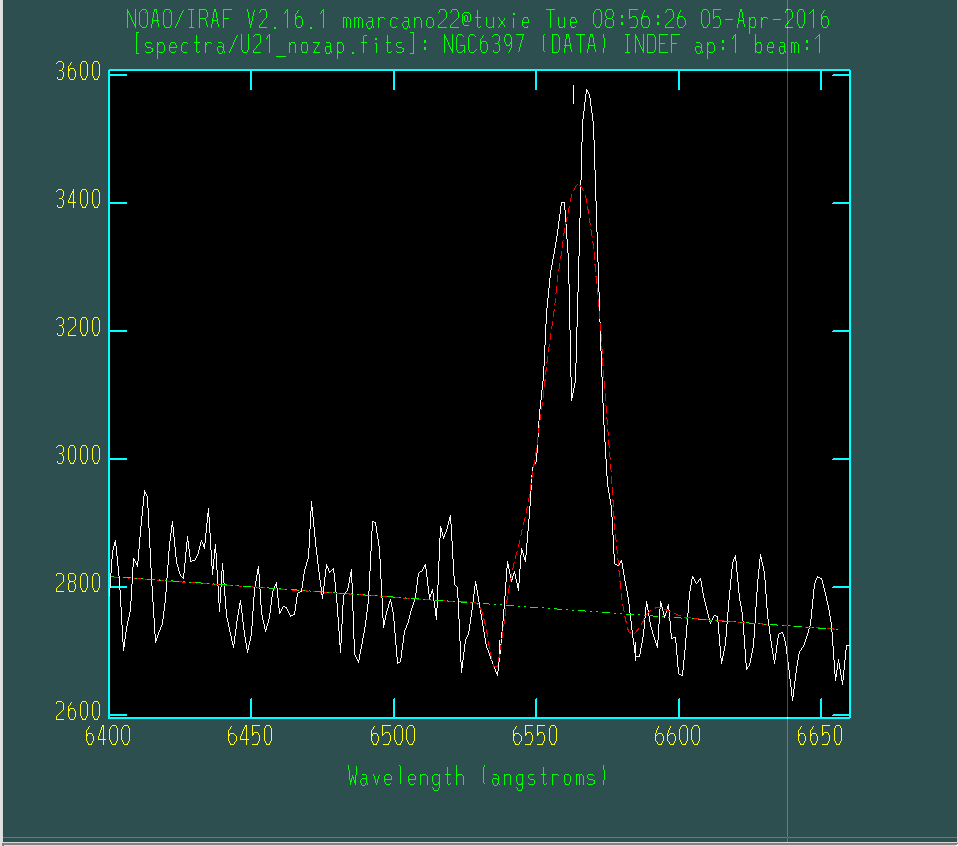
- For the Gaussian fit:
center cont flux eqw core gfwhm lfwhm
6565.22 2764.228 18434.7 -6.669 673.466 25.72 0.
U23 (CV1)
The Spectra
splot spectra/U23_nozap.fits xmin=6400 xmax=6660
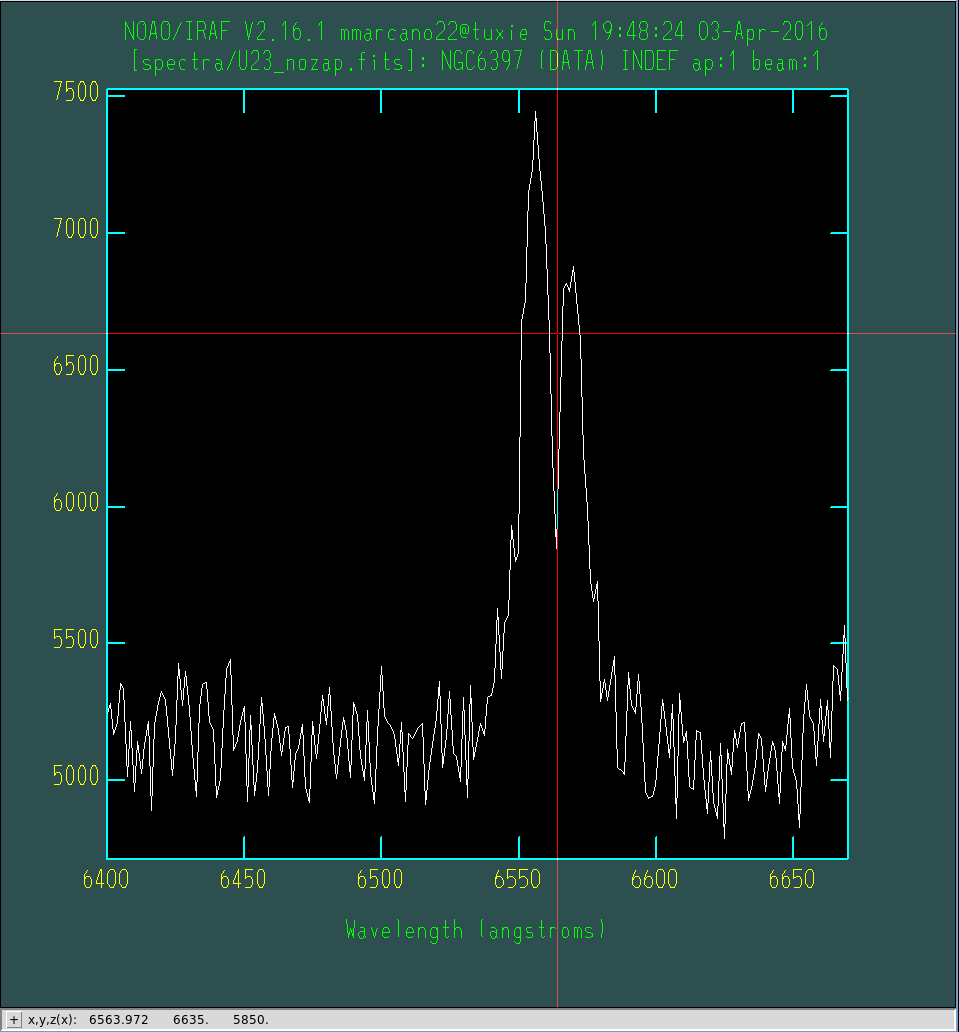
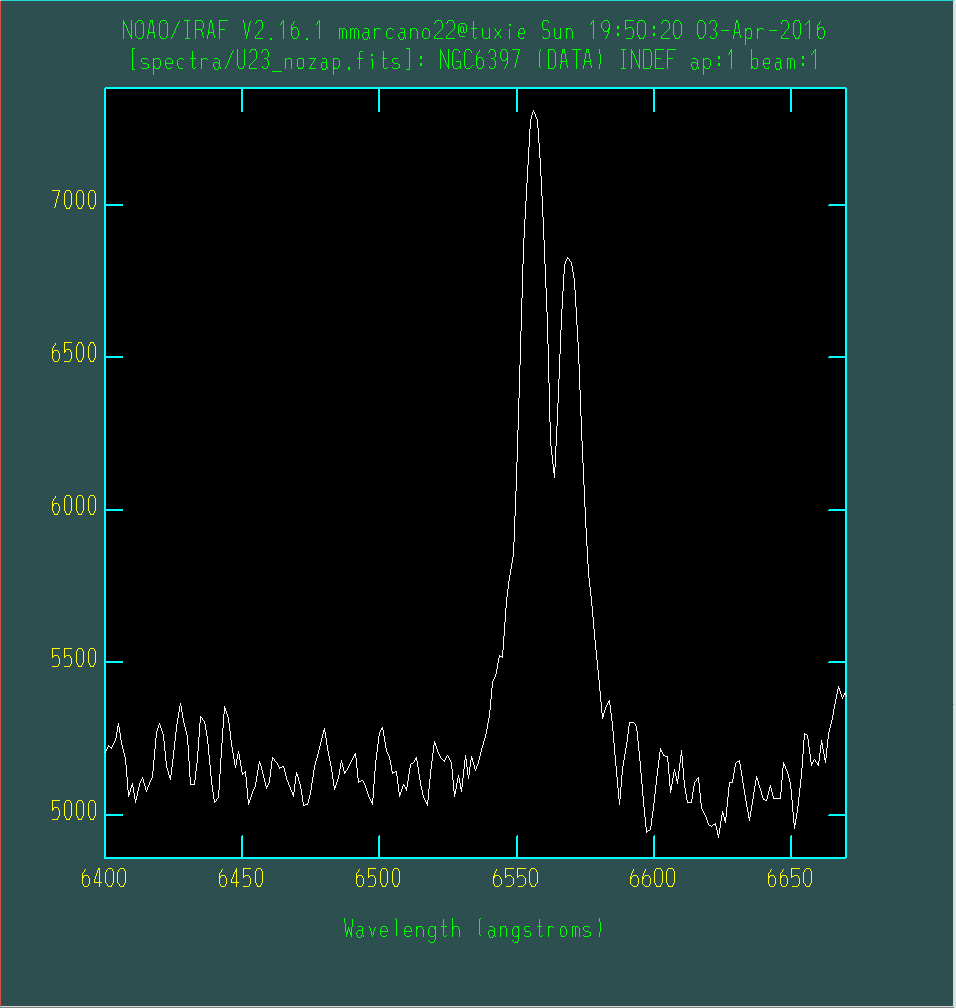
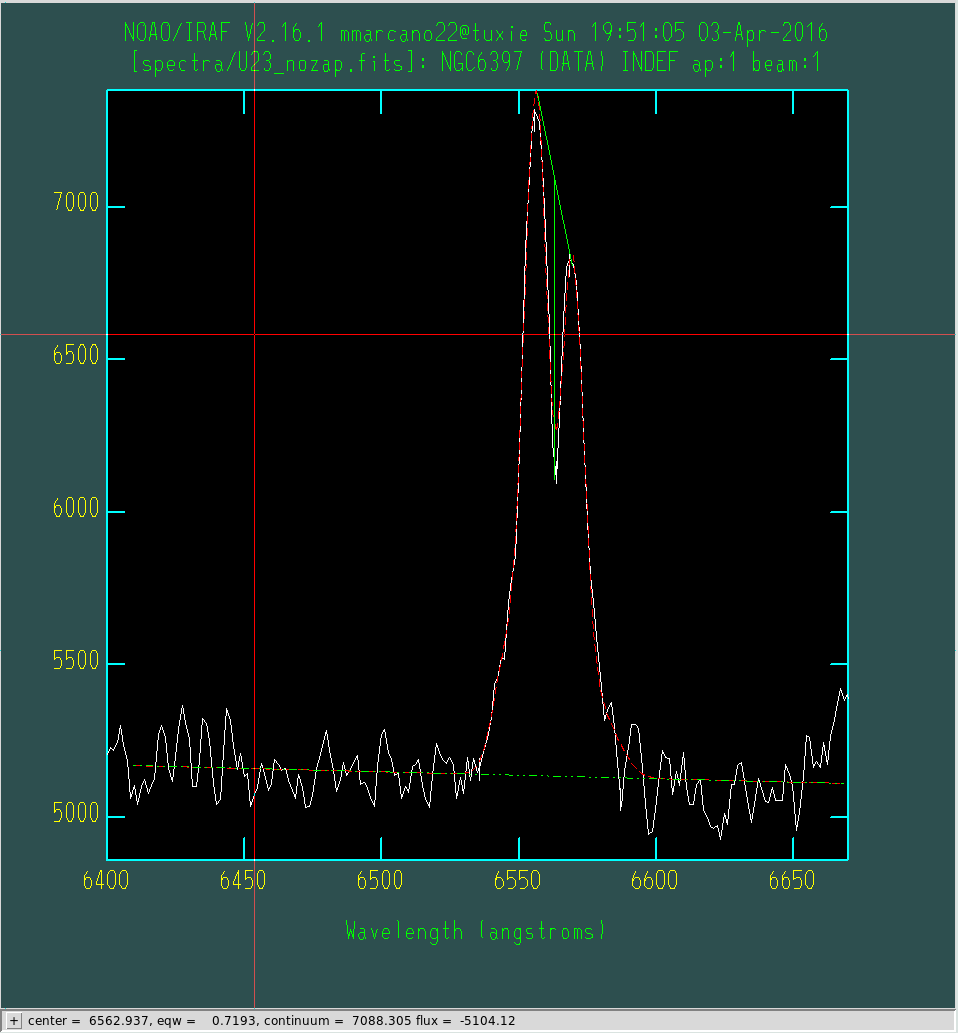
We get:
- For the Double Peak: Center at 6562.937 and eqw of 0.7193 Ångström.
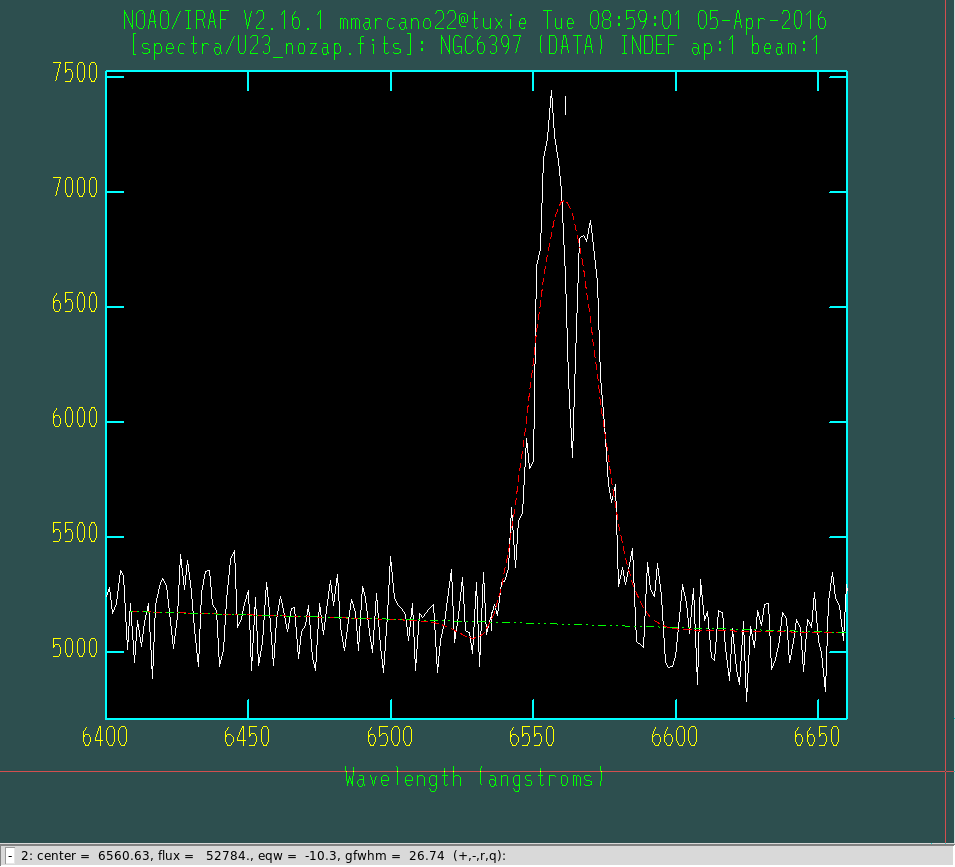
- For the Gaussian fit:
center cont flux eqw core gfwhm lfwhm
6560.626 5124.967 52784.1 -10.3 1854.63 26.74 0.
U17 (CV3)
The Spectra
splot spectra/U17_nozap.fits xmin=6400 xmax=6660
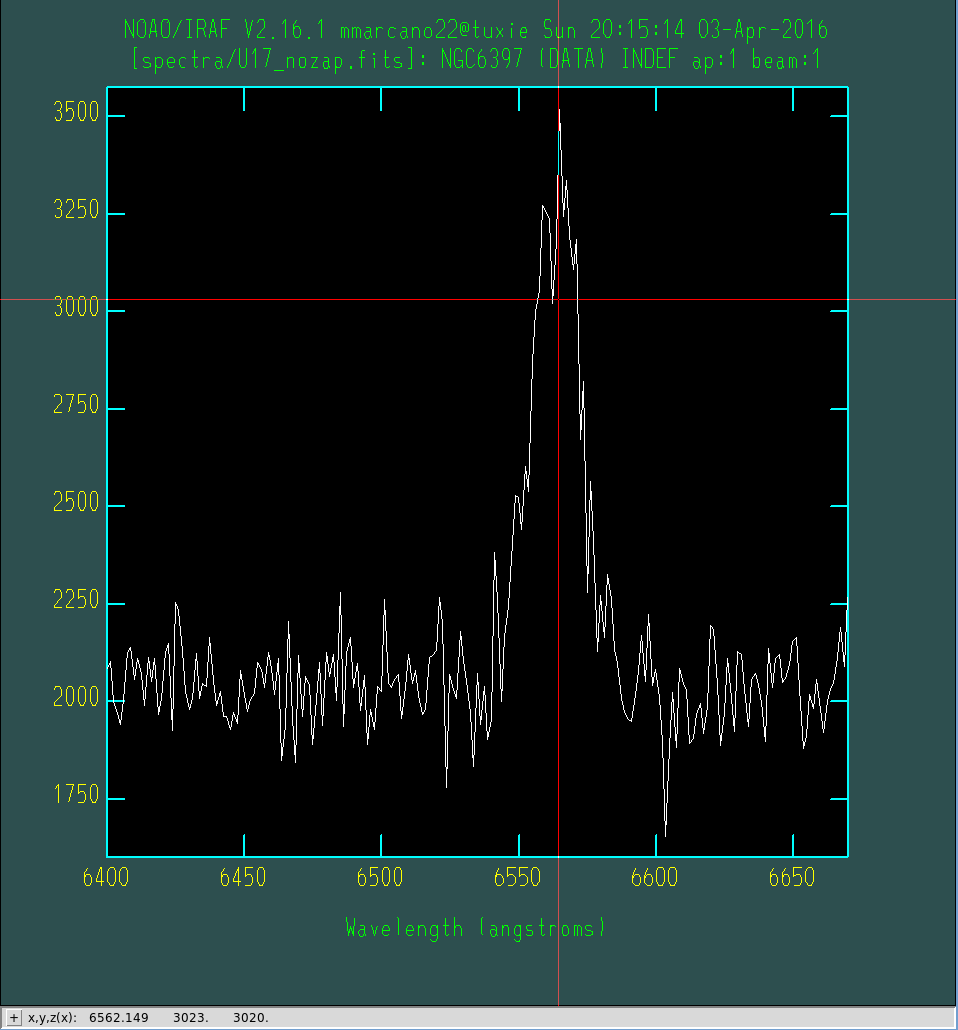
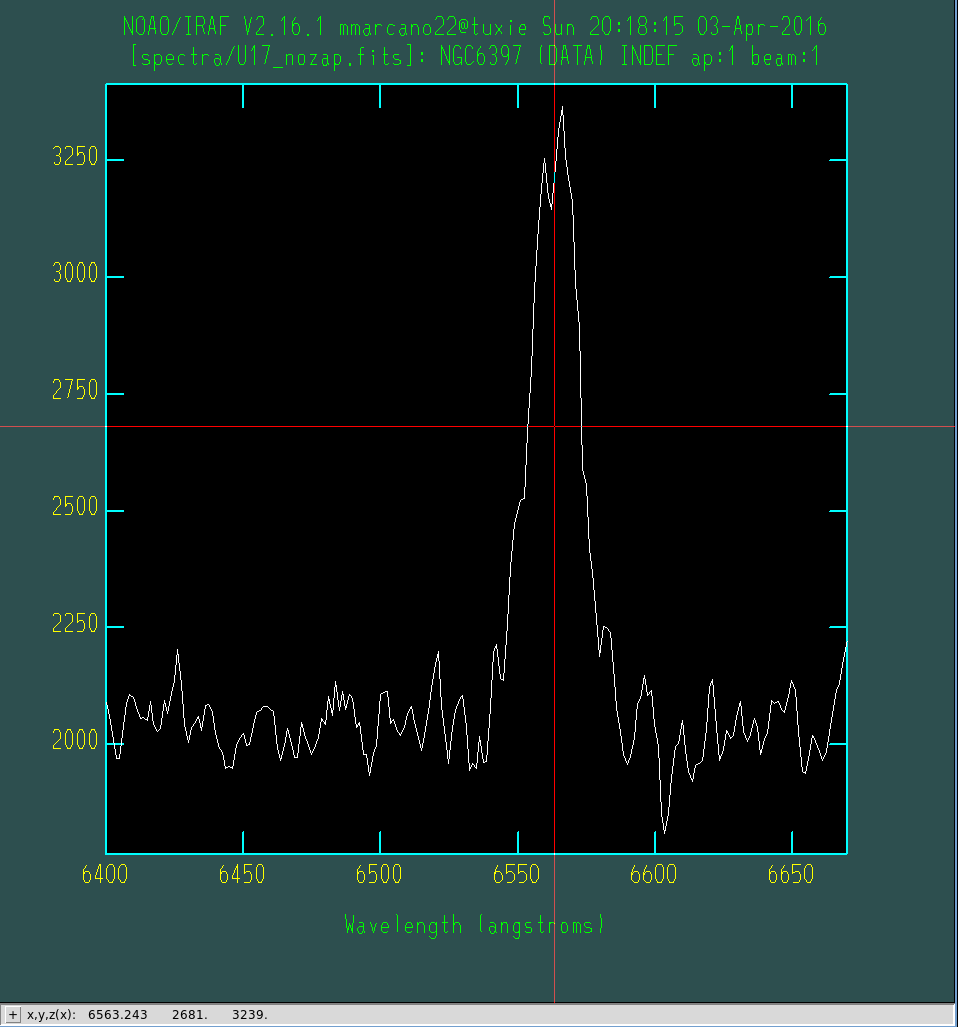
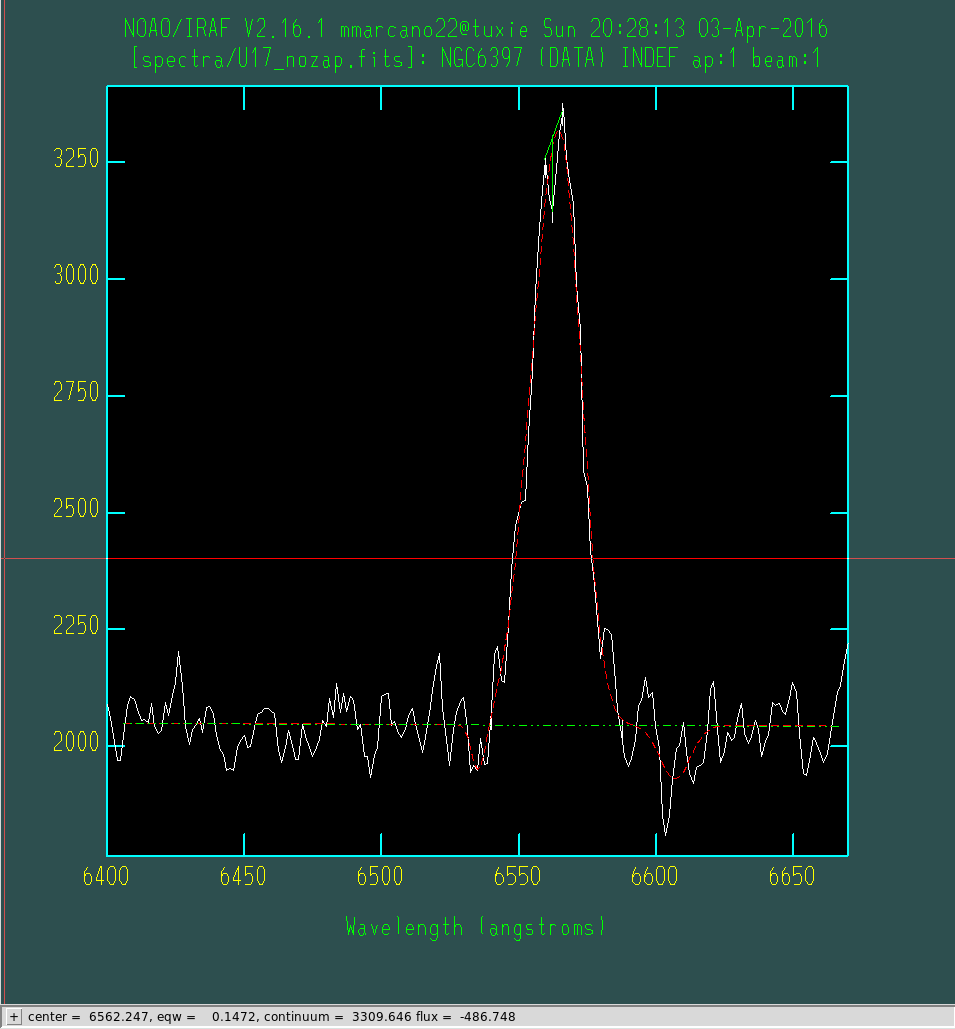
We get:
- For the Double Peak: Center at 6562.247 and eqw of 0.1472 Ångström.
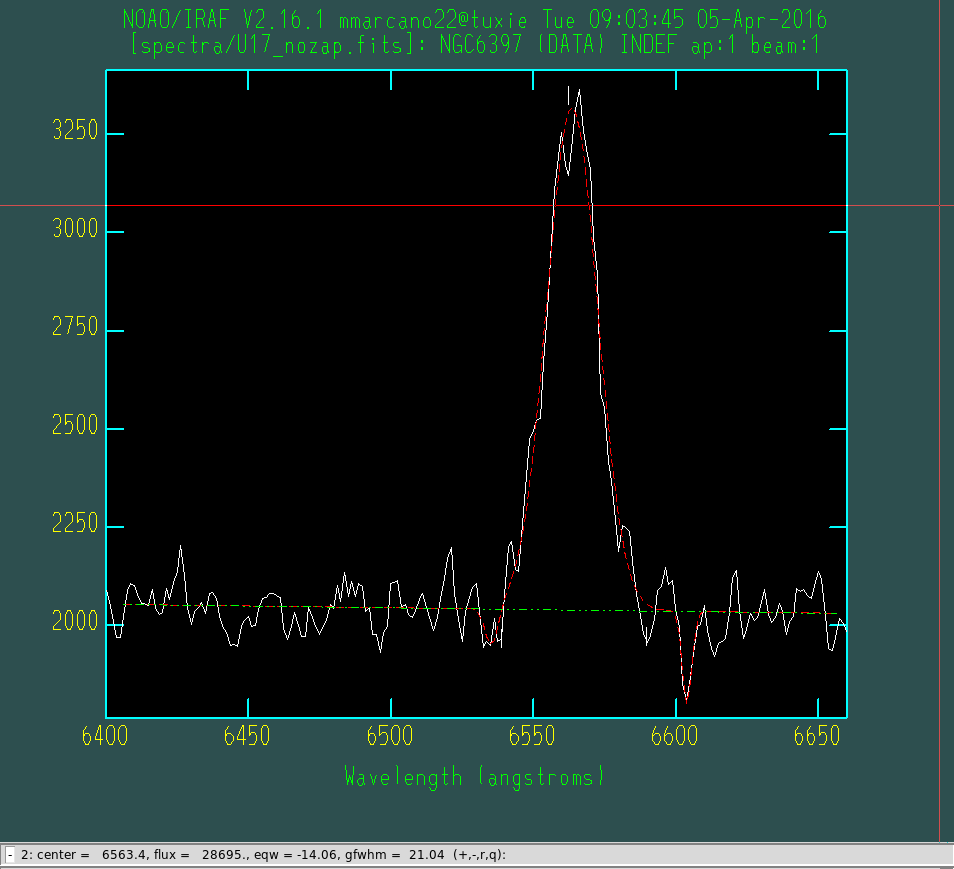
- For the Gaussian fit:
center cont flux eqw core gfwhm lfwhm
6563.396 2040.292 28694.5 -14.06 1280.98 21.04 0.
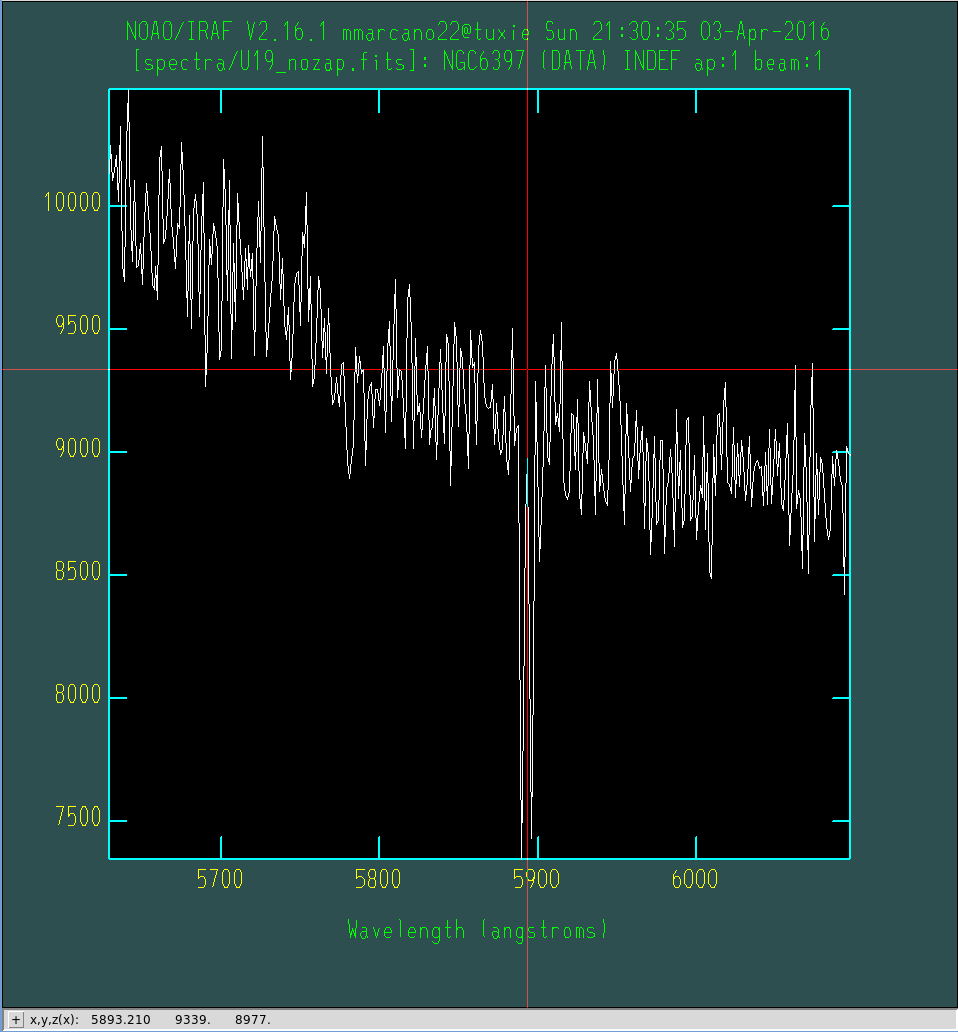
U19 (CV2)
Check if it is CV. Is th line at 5895 He I line in absorption ?
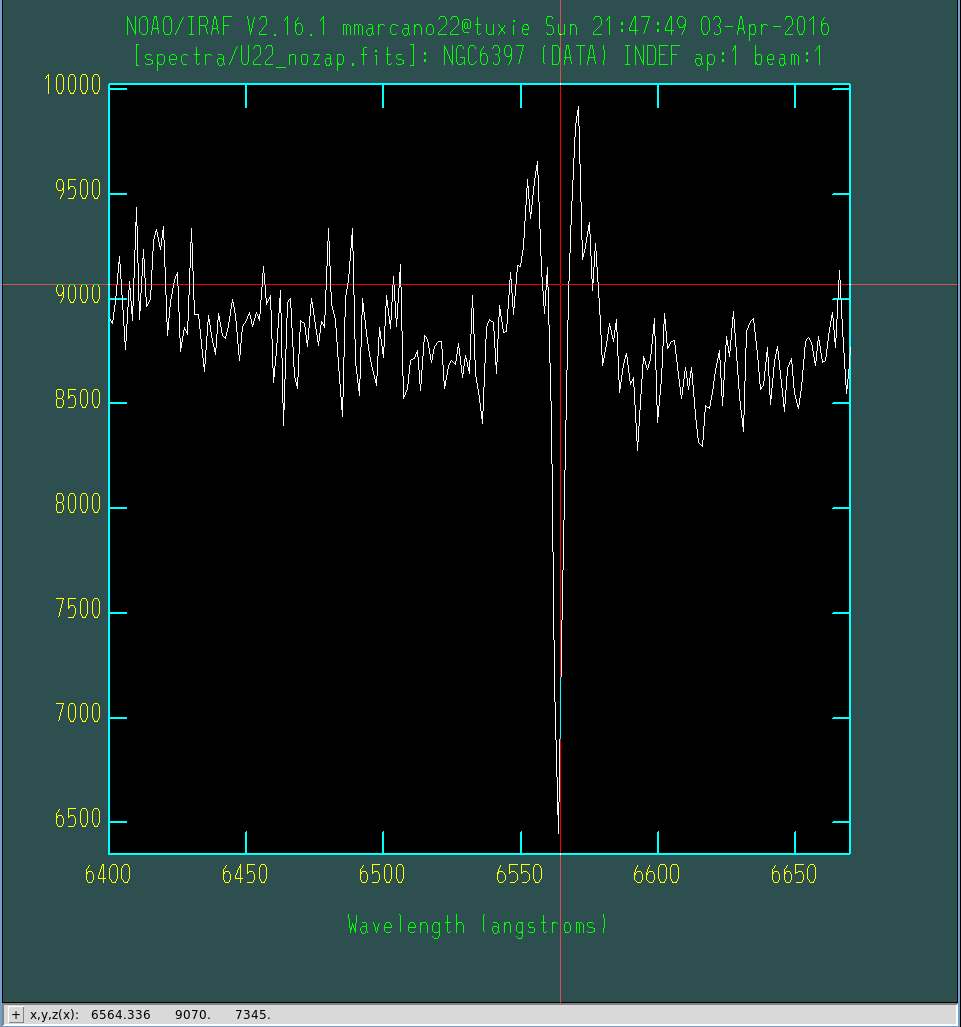
U22 (CV5)
Check stars around U22.
Is this emission and absorption?
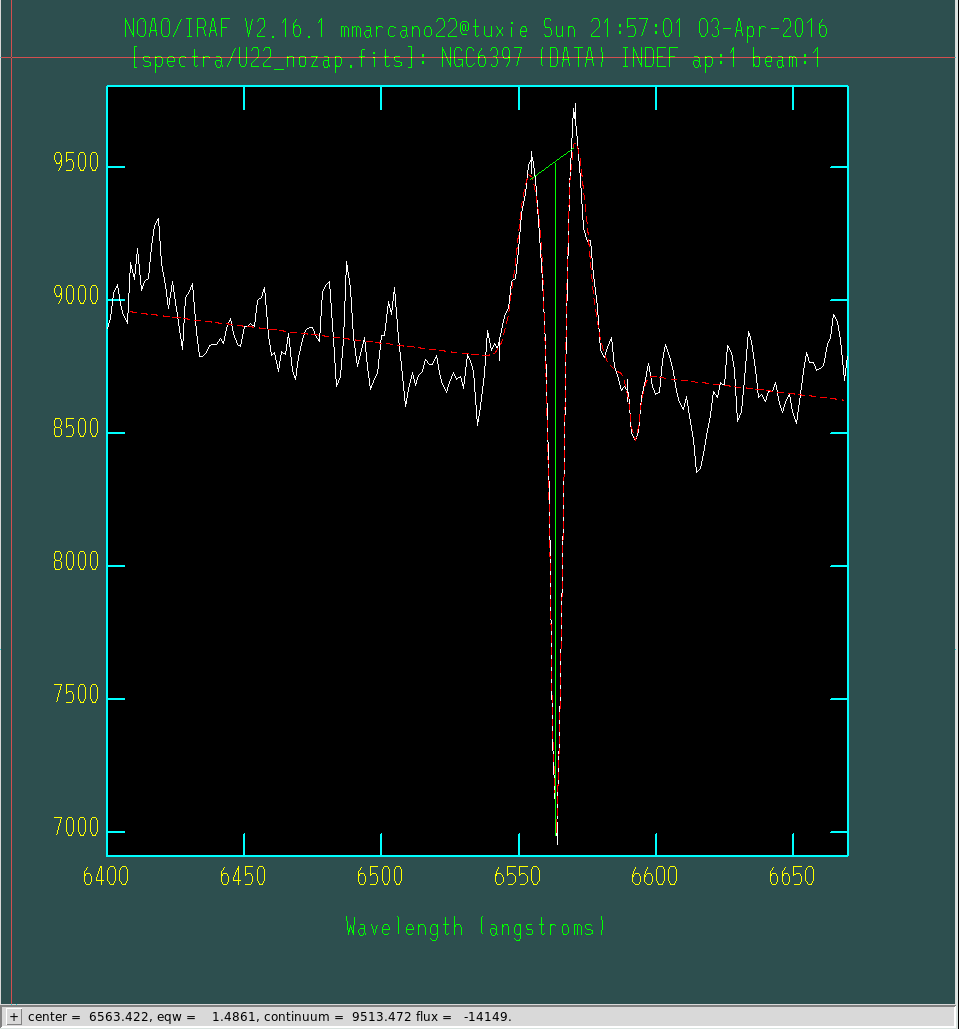
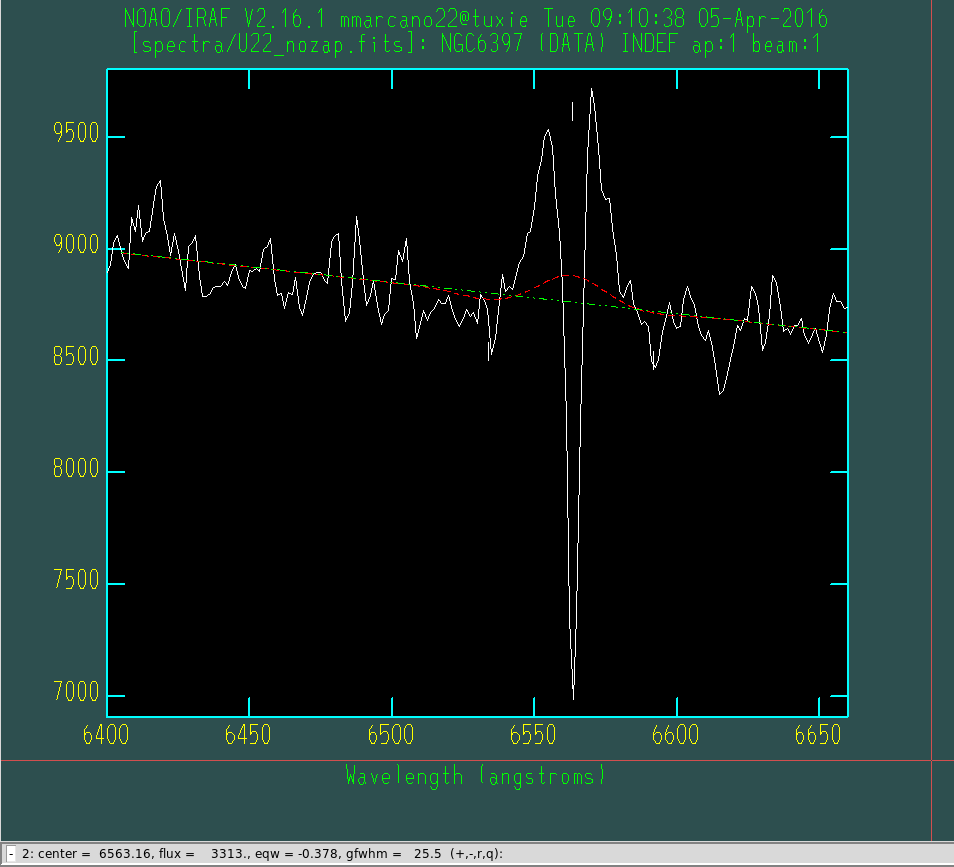
We get:
- For the Double Peak: Center at 6563.422 and eqw of 1.4861 Ångström.
- For the Gaussian fit:
center cont flux eqw core gfwhm lfwhm
6592.22 10826.1 -1136.66 0.105 -254.768 4.191 0.
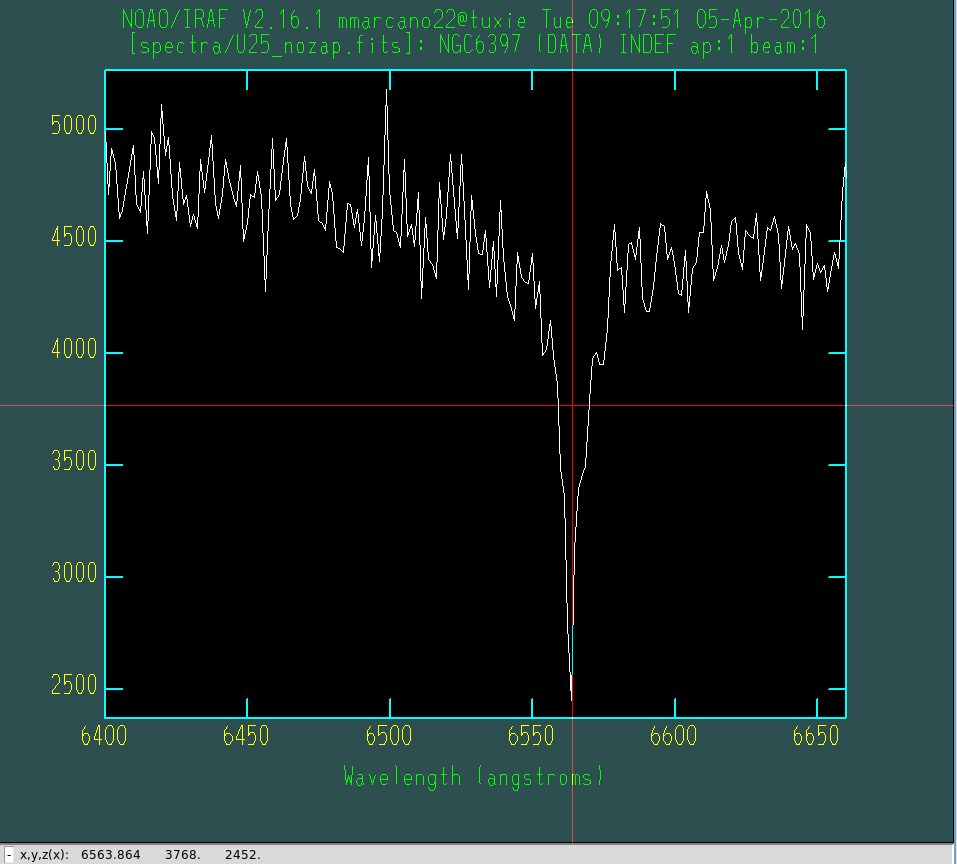
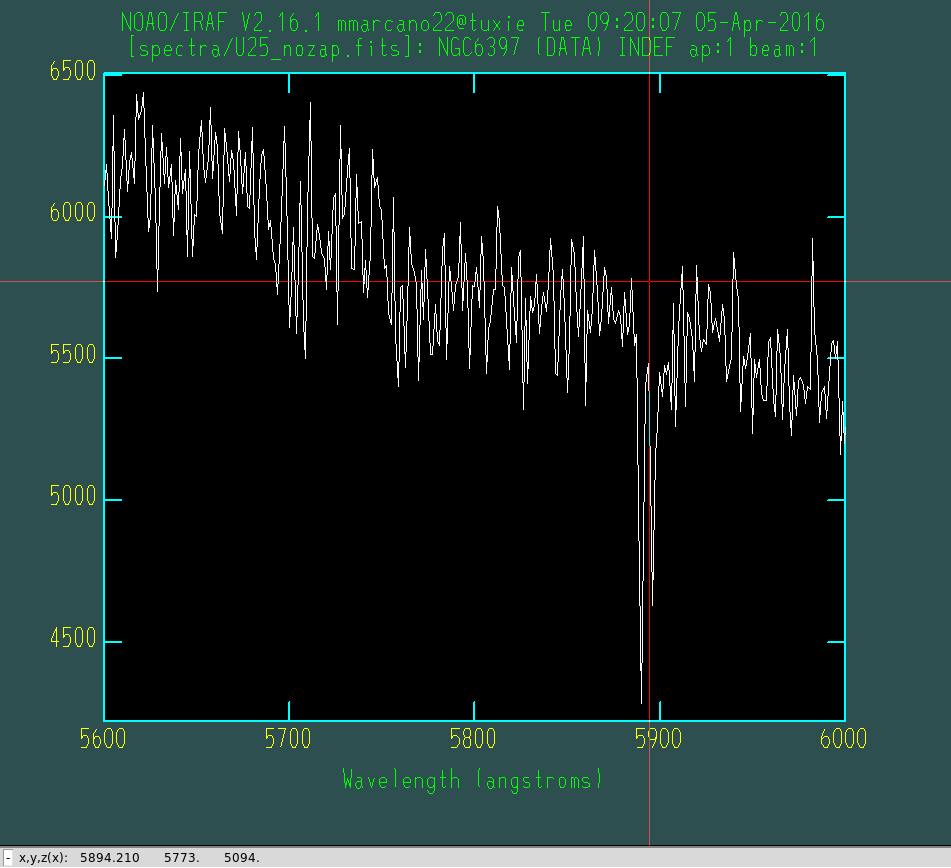
U25 (CV13)
Only H\(alpha\) absoption bit He II like the other one?
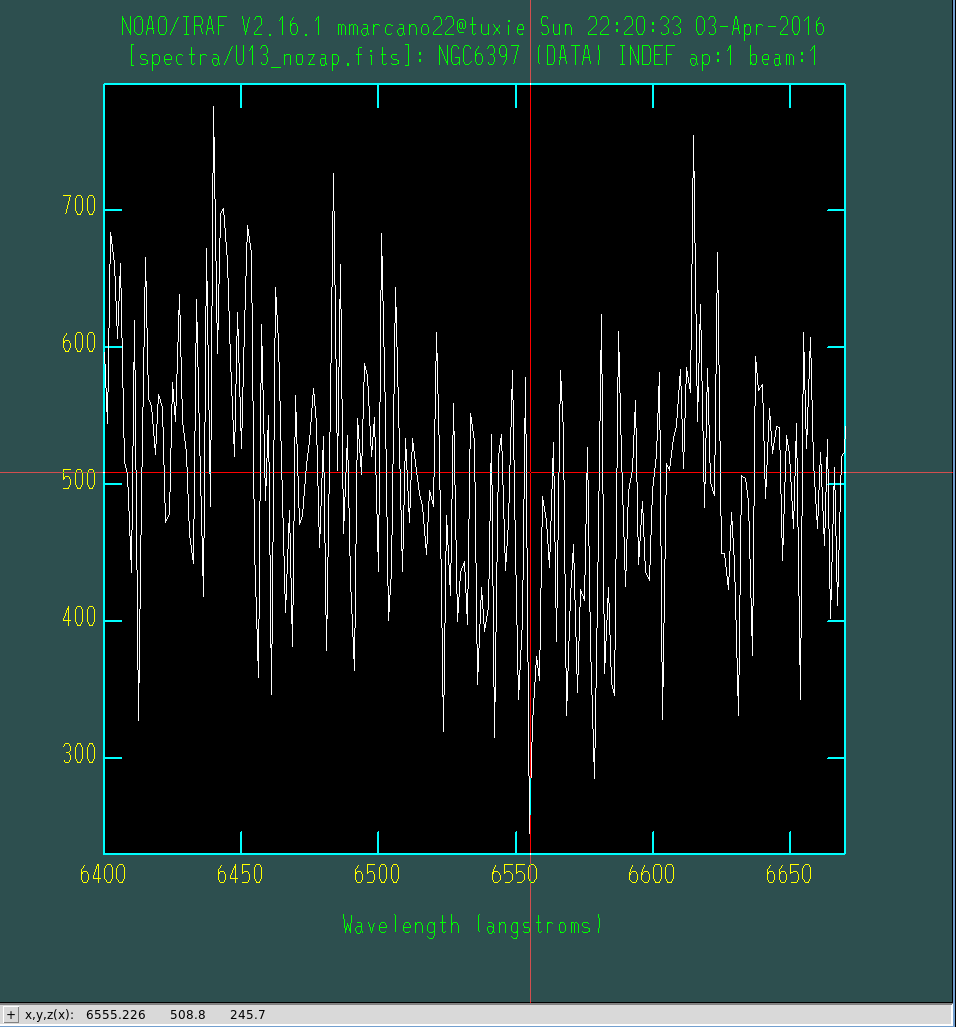
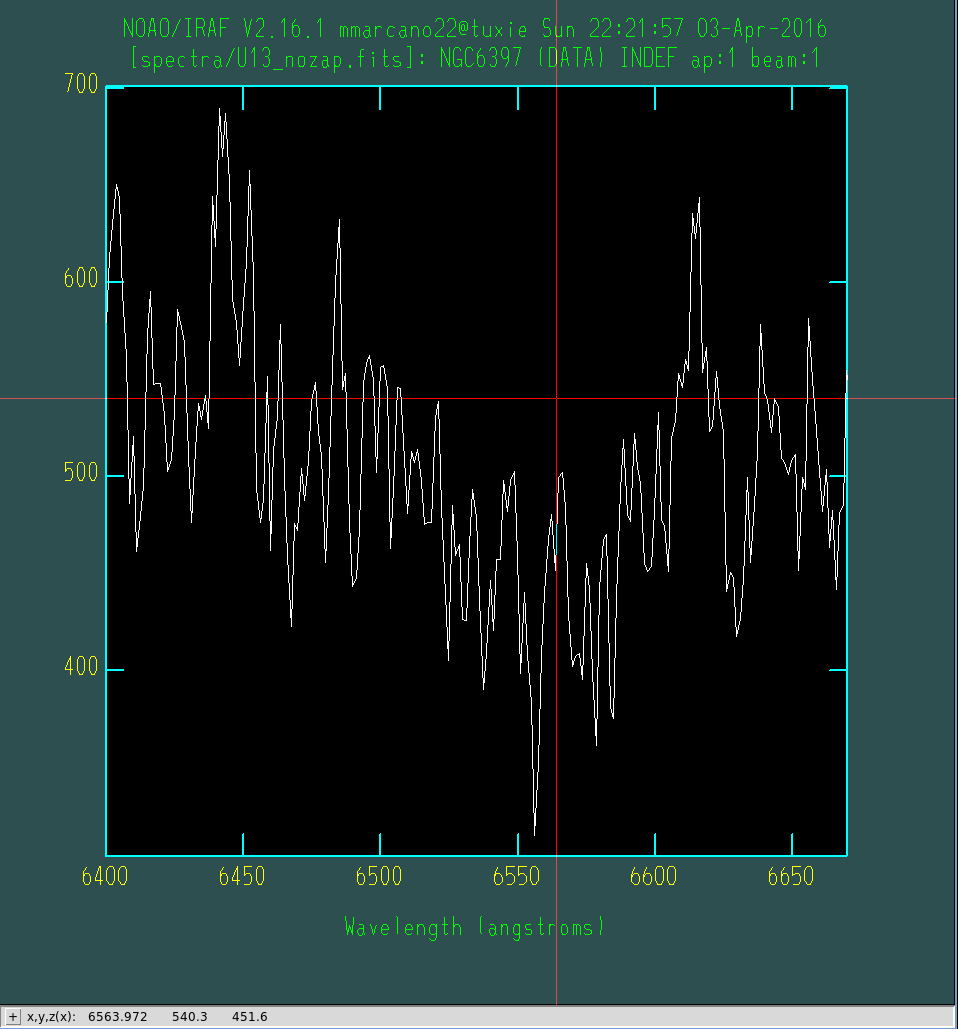
U13 (CV8)
Before Smooth
After Smooth
U61 (CV12)
I don’t really see much. Also see line at 5892 A.
U10 (CV6)
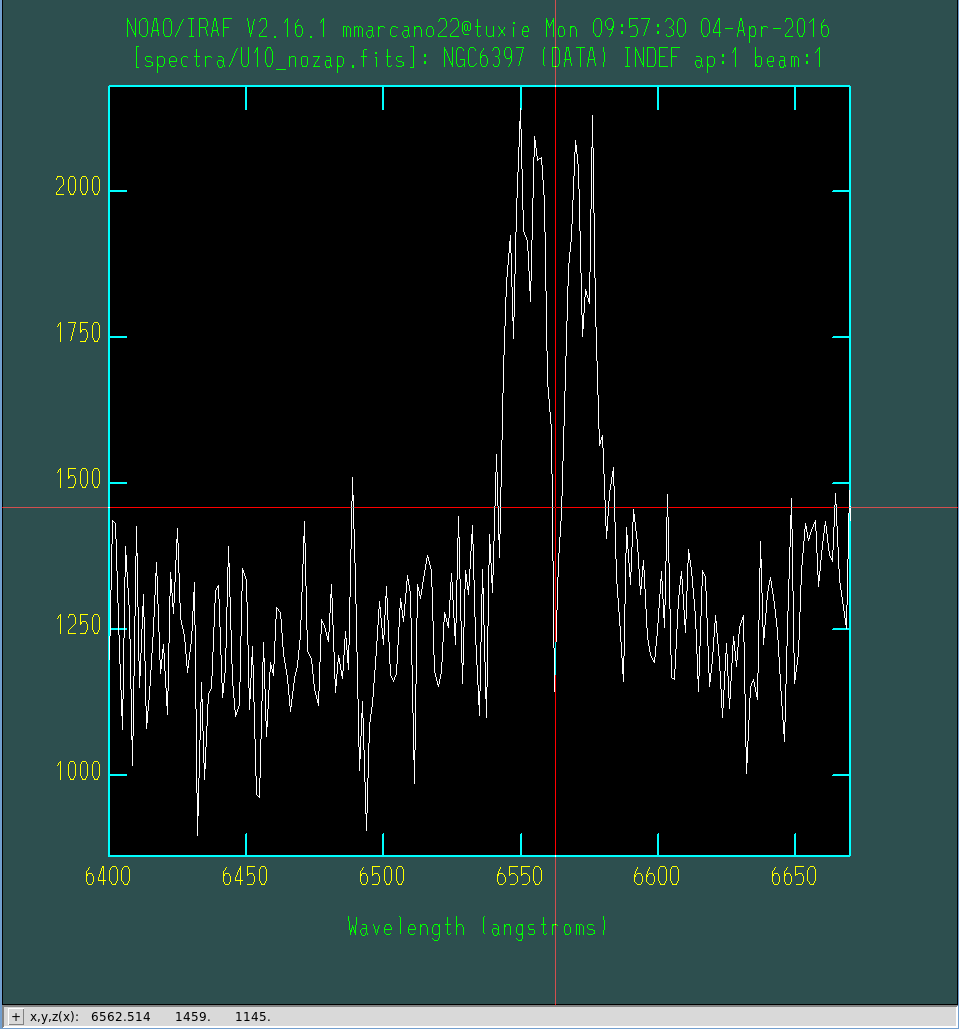
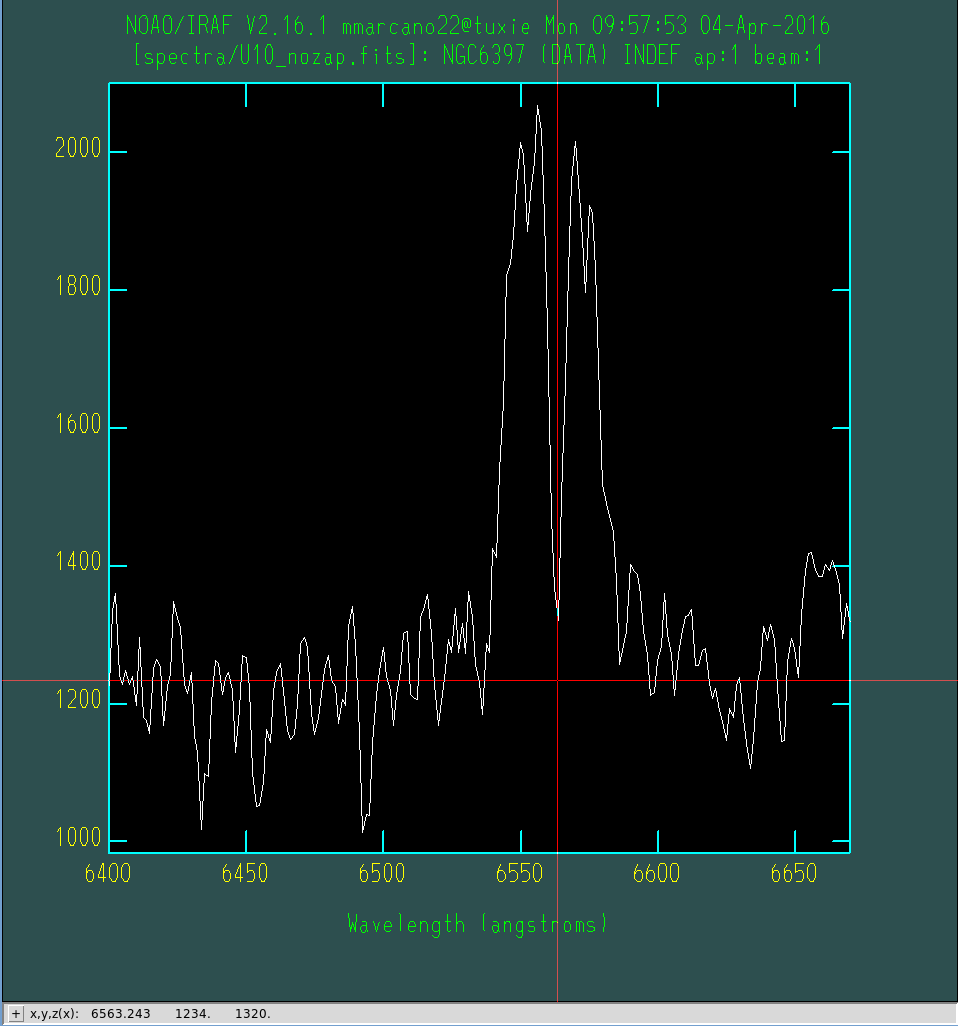
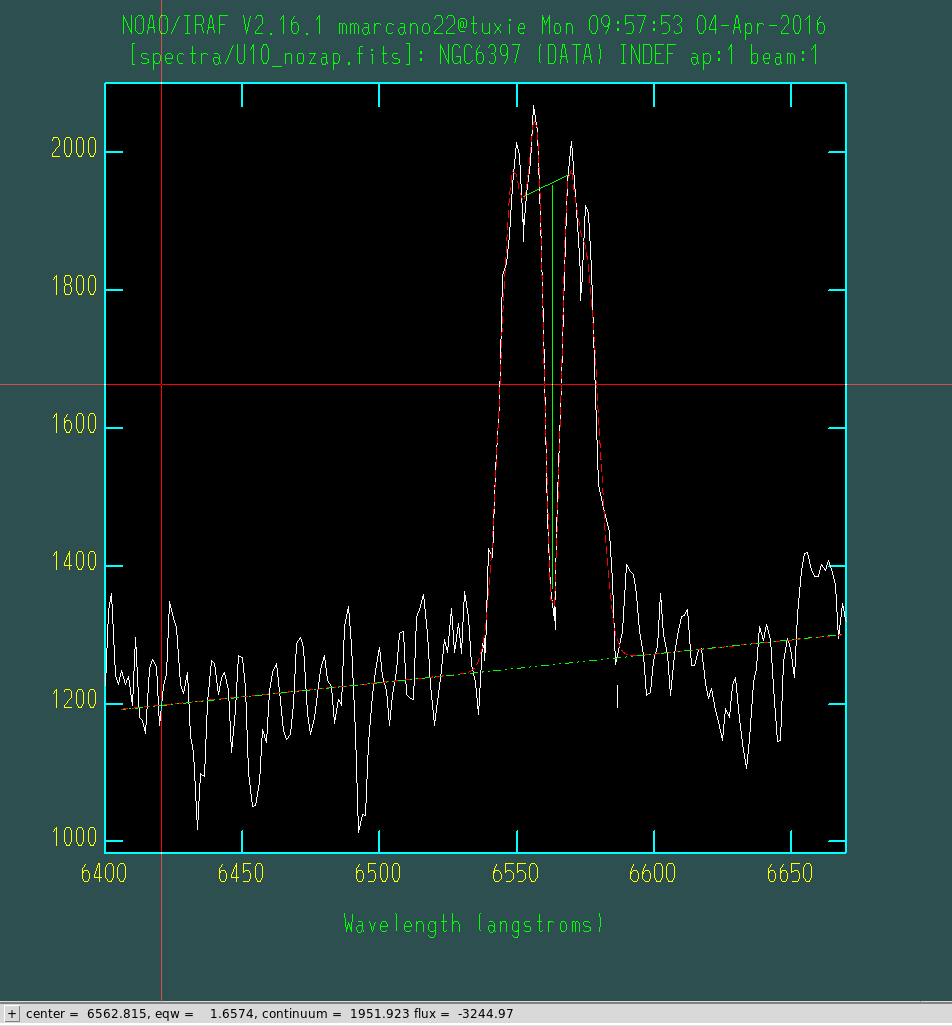
Questions
- [ ] Smooth or not?
- [ ] Their model is a 2-Gaussian of identical width and height. How?
- [ ] How to mask the He I line?
- [ ] U22 and U19, and U25, U61
References
Casares J. Mass ratio determination from Halpha lines in Black-Hole X-ray transients. ArXiv e-prints [Internet]. 2016 Mar 1 [cited 2016 Apr 1];1603:arXiv:1603.08920. Available from: http://adsabs.harvard.edu/abs/2016arXiv160308920C
Cohn HN, Lugger PM, Couch SM, Anderson J, Cool AM, van den Berg M, et al. Identification of Faint Chandra X-ray Sources in the Core-collapsed Globular Cluster NGC 6397: Evidence for a Bimodal Cataclysmic Variable Population. The Astrophysical Journal [Internet]. 2010 Oct 1 [cited 2016 Mar 4];722:20–32. Available from: http://adsabs.harvard.edu/abs/2010ApJ…722…20C
Grindlay JE, Cool AM, Callanan PJ, Bailyn CD, Cohn HN, Lugger PM. Spectroscopic Identification of Probable Cataclysmic Variables in the Globular Cluster NGC 6397. The Astrophysical Journal Letters [Internet]. 1995 Dec 1 [cited 2016 Mar 10];455:L47. Available from: http://adsabs.harvard.edu/abs/1995ApJ…455L..47G
Grindlay JE. High Resolution Studies of Compact Binaries in Globular Clusters with HST and ROSAT. In 1996 [cited 2016 Apr 3]. p. 171. Available from: http://adsabs.harvard.edu/abs/1996IAUS..174..171G
Cool AM, Bolton AS. Blue Stars and Binary Stars in NGC 6397: Case Study of a Collapsed-Core Globular Cluster. In eprint: arXiv:astro-ph/0201166; 2002 [cited 2016 Apr 3]. p. 163. Available from: http://adsabs.harvard.edu/abs/2002ASPC..263..163C
Harris WE. A Catalog of Parameters for Globular Clusters in the Milky Way. The Astronomical Journal [Internet]. 1996 Oct 1 [cited 2016 Mar 31];112:1487. Available from: http://adsabs.harvard.edu/abs/1996AJ….112.1487H